Coral bleaching due to ocean warming associated with climate change has impacted coral reefs worldwide. Mass coral bleaching events occur during extended periods of elevated sea surface temperatures and have the potential to result in significant and widespread loss of coral (GBRMPA, 2017).
In 2016, the worst coral bleaching on record (at the time) impacted the Great Barrier Reef Marine Park. A second consecutive bleaching event occurred in early 2017. While two previous widespread bleaching events have occurred on the Great Barrier Reef (1998 and 2002), consecutive bleaching events had not been recorded previously, with recovery possible during the cooler intervals.
In April 2020, a third mass bleaching event was recorded in the Great Barrier Reef Marine Park. This was the most geographically widespread bleaching event recorded yet. After a short period of recovery in 2021, during March 2022 parts of the Far North and inshore areas between Townsville and Rockhampton varied between 2−4°C above average, this marks the fourth mass coral bleaching event in seven years.
CORAL BLEACHING ON THE GREAT BARRIER REEF
Corals are able to survive in a limited temperature range (between 23°C to 29°C, although some species can tolerate up to 40°C for short periods) and when the temperature exceeds this limit, they experience heat stress. When under stress, they expel their symbiotic, microscopic algae (called zooxanthellae) that give coral much of their colour and food. Without their zooxanthellae, coral tissues become transparent, exposing their bright white skeleton underneath (Figure 1). If the stress is prolonged, bleached corals begin to starve without their zooxanthellae to feed them. After they have died, coral skeletons are colonised by larger algae (Figure 1).
Figure 1. Examples of healthy, bleached and dead coral. Picture credit: Great Barrier Reef Marine Park Authority
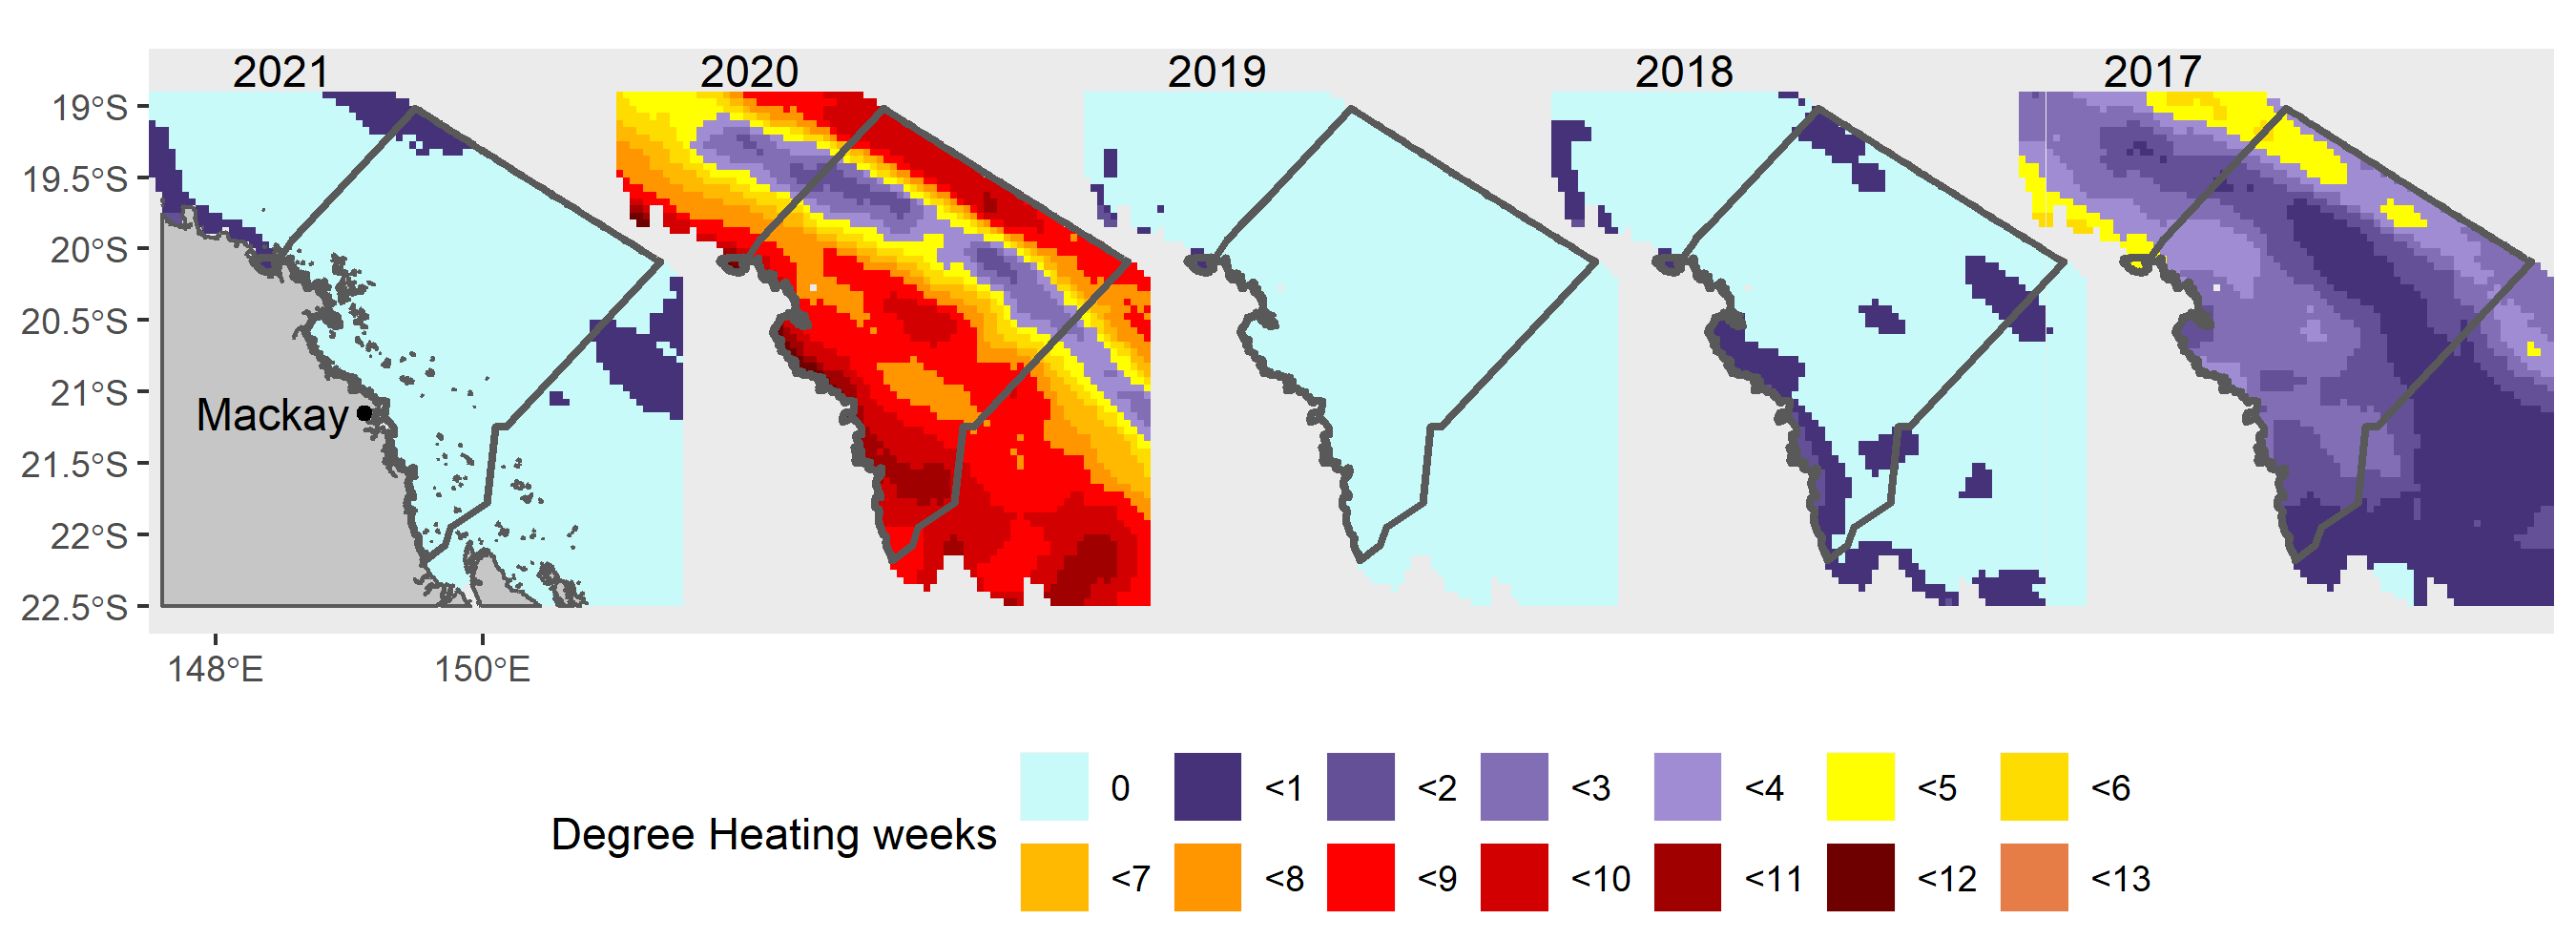
In the MWI region, 2021 had fewer Degree Heating Weeks than 2020, with no parts of the inshore reef reaching four DHW (Figure 1). Despite being warmer than average, the conditions were relatively milder in 2021 and there were no prolonged high temperatures or major cyclone events (GBRMPA, 2021). However, full recovery and future health of coral depends on continued lack of disturbances.
Figure 1: Heat stress in coral is a measure of the duration of time in which the temperature exceeds the long-term mean maximum, with four Degree Heating Weeks (DHW) likely to cause significant coral bleaching. (NOAA Coral Reef Watch)
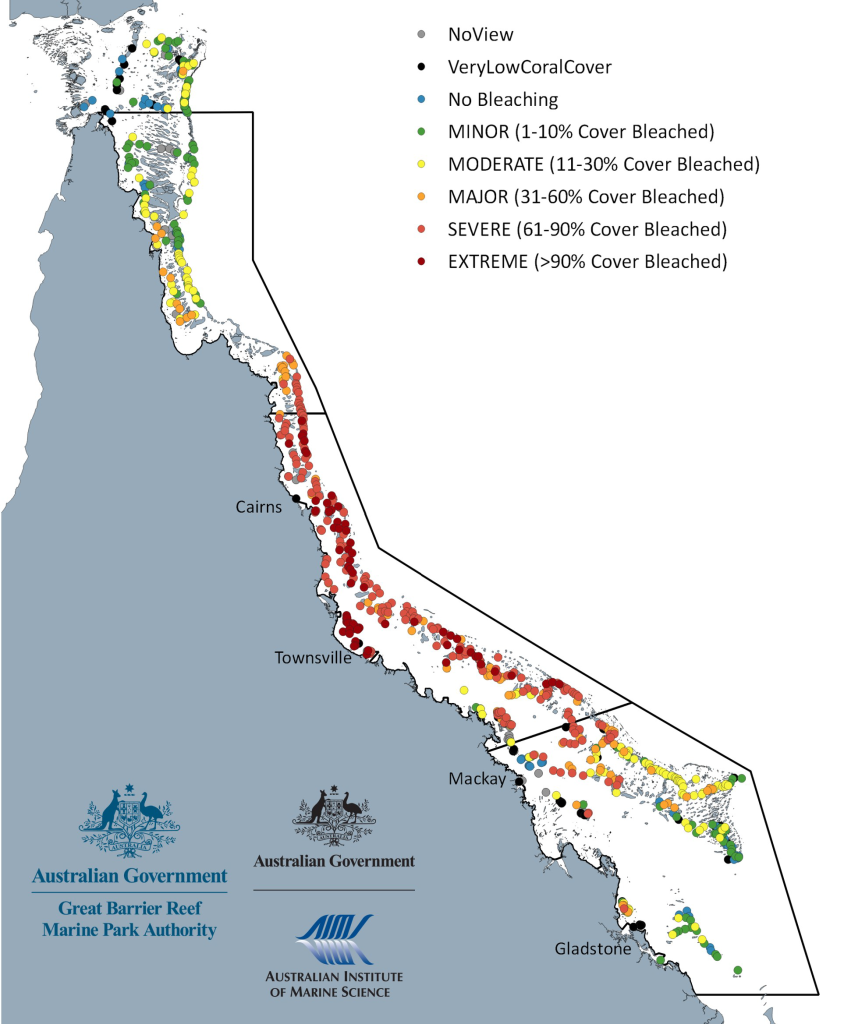
The coral had very little time to recover, and according to GBRMPA Reef Health updates, most of the GBR Marine Park accumulated significant heat stress over the 21/2022 summer. December 2021 recorded the hottest temperatures on record since 1900, despite La Niña conditions. Ocean temperatures continued to rise throughout the summer and were between 2-4°C above average during March 2022. Aerial surveys across the Great Barrier Reef were completed in late March 2022, and observed bleaching was largely consistent with the spatial distribution of the heat stress experienced (Figure 2). Sea surface temperatures were between 0.5–2°C above average for mid-April 2022 throughout most of the Marine Park and a mass bleaching event was confirmed, the fourth since 2016 and despite La Niña conditions.
Figure 2: Findings of the GBRMPA 2022 aerial surveys, in ‘Reef Health update: June 2022’
It is important to note that bleached coral is stressed but still alive. If conditions are moderate, bleached corals can recover from this stress, as was the case in 2020 when there was very low coral mortality associated with a mass bleaching event. Full extent of coral mortalities will only be known after the next round of monitoring surveys.
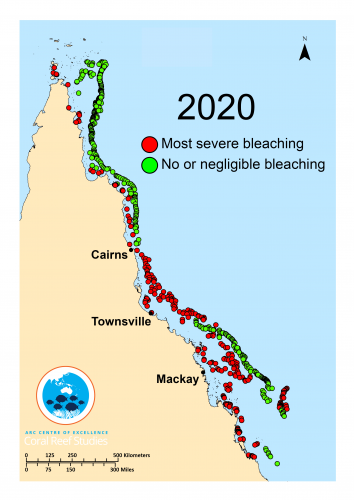
There is concern about the cumulative effects of the proximity of recent bleaching events. Reefs may have a chance to recover from bleaching, however as the time between mass bleaching events shrinks, corals are being given less and less time to recover. The geographic extent of the 2020 bleaching was unprecedented. From the 1036 reefs surveyed in April 2020, bleaching was evident in all three regions of the Great Barrier Reef (northern, central, and southern) (ARC Centre of Excellence for Coral Reef Studies, 2020) (Figure 3).
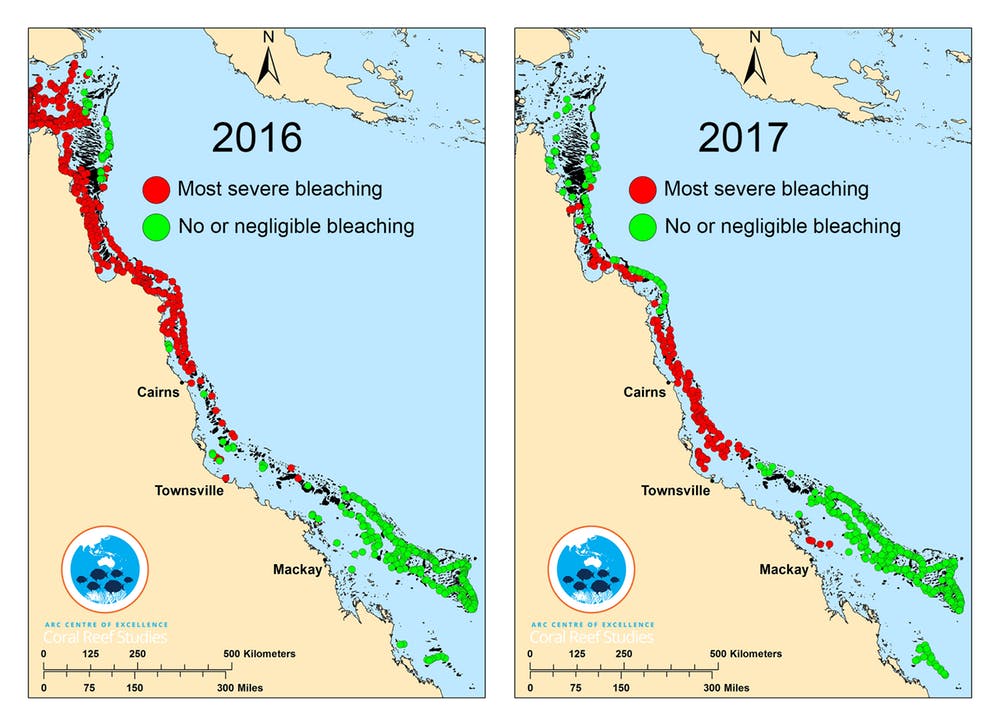
Figure 3. Results of aerial surveys undertaken by the ARC Centre of Excellence in response to the 2016, 2017 and 2020 bleaching events. © Copyright ARC CoE
Only a few years after the record-breaking sea surface temperatures of 2016 and 2017, there has been a third mass coral bleaching event on the Great Barrier Reef in the last five years. According to experts, “February 2020 had the highest monthly temperatures ever recorded on the Great Barrier Reef since the Bureau of Meteorology’s sea surface temperature records began in 1900” (ARC Centre of Excellence for Coral Reef Studies, 2020) (Figure 1).
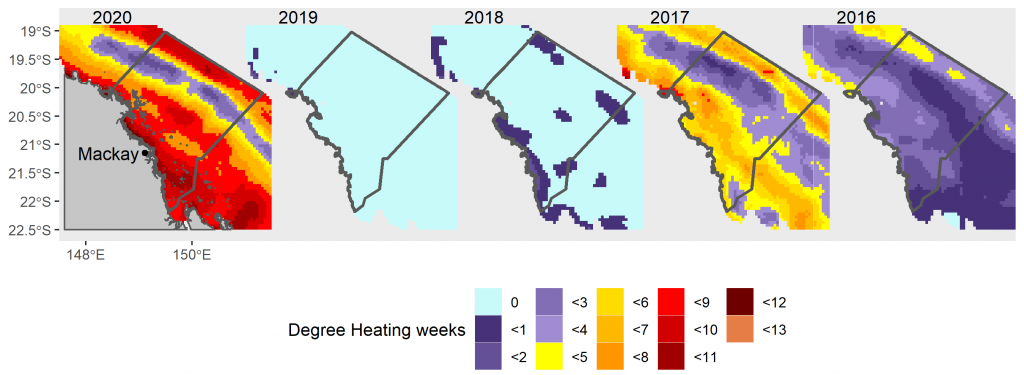 Figure 1. Degree heating weeks for the MWI Region from 2016 to 2020. This is a measure of heat stress accumulation over the past 12 weeks, by summing sea surface temperatures (SSTs) exceeding 1oC above the long-term mean maximum temperature. Source: NOAA coral reef watch.
The geographic extent of this bleaching was also unprecedented. From the 1036 reefs surveyed in April 2020, bleaching was evident in all three regions of the Great Barrier Reef (northern, central, and southern) (ARC Centre of Excellence for Coral Reef Studies, 2020) (Figure 2).
In addition to the intensity of the bleaching itself, there is concern about the cumulative effects of the proximity of recent bleaching events. Reefs may have a chance to recover from bleaching. However, as the time between mass bleaching events shrinks, corals are being given less and less time to recover.

Figure 2. Results of aerial surveys undertaken by the ARC Centre of Excellence in response to the 2016, 2017 and 2020 bleaching events. © Copyright ARC CoE
Following the record-breaking temperatures of 2016, sea surface temperatures on the Great Barrier Reef (GBR) again exceeded long-term averages from January to March 2017, causing an unprecedented second consecutive year of bleaching. Patterns of bleaching intensity shifted from the northern reefs of the GBR in 2016 to the central reefs in 2017 (Figure 1). Whilst coral bleaching in 2017 was observed in all four Natural Resource Management Regions (NRM), the impacts varied, with the most impacted reefs located in the Wet Tropics and Burdekin Regions (Thompson et al. 2018). Aerial and in-water surveys undertaken by the ARC Centre of Excellence for Coral Reef Studies as part of the coral bleaching taskforce, revealed that some middle shelf reefs surveyed offshore of Mackay suffered bleaching (refer figure below). Back-to-back bleaching can result in compounding impacts on coral reefs, reducing resilience and potentially increasing the risk of death from subsequent bleaching events (read more here).

Figure 1. Results of aerial surveys undertaken by the ARC Centre of Excellence in response to the 2016 and 2017 bleaching events. © Copyright ARC CoE
Impacts of Tropical Cyclone Debbie
On the 28th March 2017, Severe Tropical Cyclone Debbie made landfall near Airlie Beach on the north Queensland coast. The powerful Category 4 storm system brought severe weather, with wind speeds reaching 263 km/h and extreme rainfall resulting in major flooding across the region. The passage of Tropical Cyclone Debbie caused varying levels of damage to reefs in the Mackay Whitsunday Region, which confounded the ability to assess bleaching impacts from the 2017 bleaching event (Thompson et al. 2018). See our Cyclone Debbie special feature for further information about the recovery of reefs around the Whitsunday Islands.
More information is available on GBRMPA’s website as well as the website of the ARC Centre of Excellence for Coral Reef Studies.
The Great Barrier Reef Marine Park Authority (GBRMPA) and Queensland Parks and Wildlife Service undertook in-water surveys during March – June 2016 and then September – November 2016 to assess the severity of the bleaching event and the survivorship of the same reefs six months later. Reefs in the Whitsundays were monitored as part of this process. No in-water surveys were undertaken in the Mackay or Isaac areas.
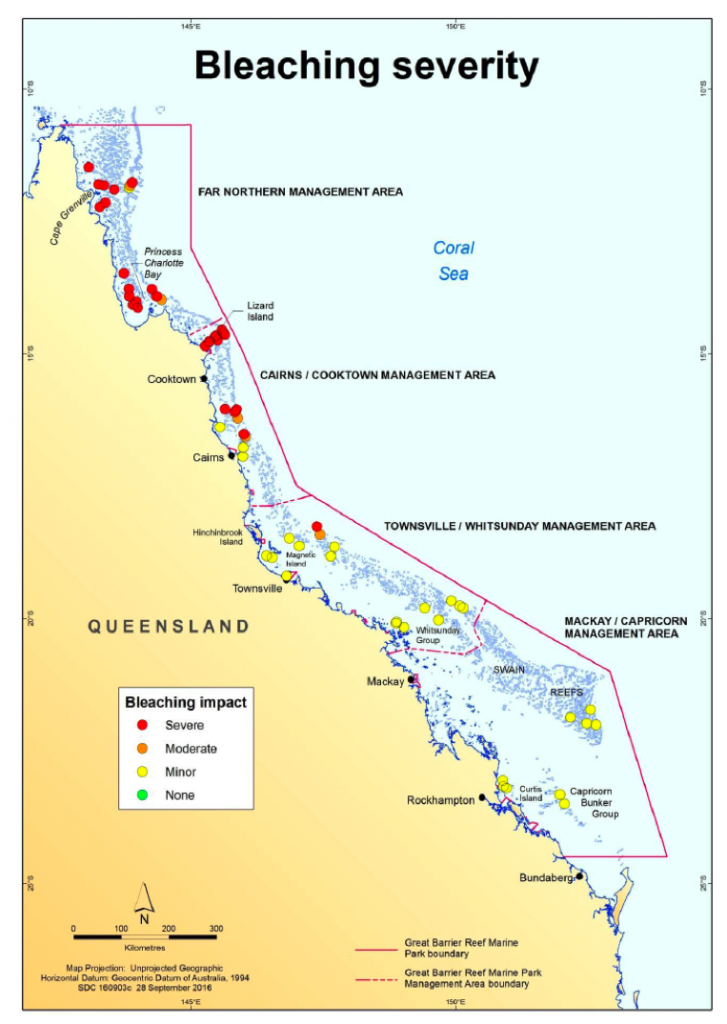
The first round of surveys documented widespread but patchy bleaching with varying levels of severity throughout the marine park in 2016 (GBRMPA) (Figure 1). Reefs in the Whitsunday area sustained minor bleaching.
Figure 1. Reef-wide pattern of bleaching severity impacts on the Great Barrier Reef in 2016 on 62 reefs surveyed using the Reef Health Impact Survey method. Each circle represents a survey reef and colours indicate severity category (© Copyright Commonwealth of Australia 1996 – 2007 GBRMPA, 2017).
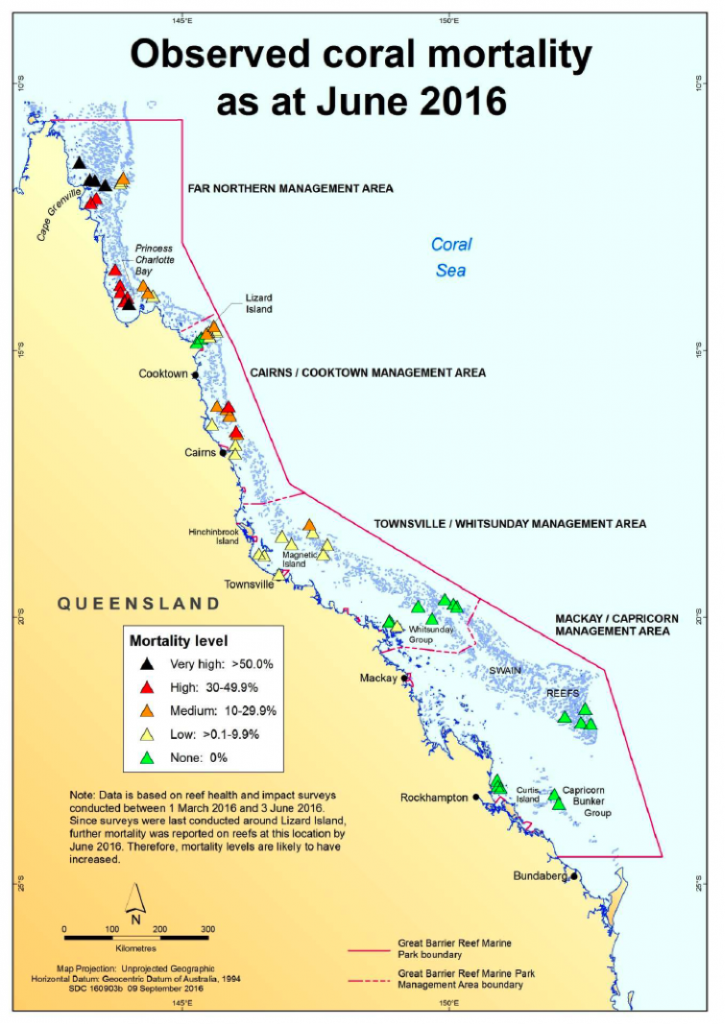
In areas that experienced the most severe coral bleaching subsequent coral mortality increased substantially during 2016, particularly in the north of the Marine Park. The June 2016 surveys showed reefs in the Whitsundays sustained low to no mortality (Figure 2).
Figure 2. Reef-wide pattern of observed recent coral mortality due to coral bleaching as at June 2016 on the Great Barrier Reef. Each triangle represents a reef, and colours indicate the percentage of coral cover that died (mortality level)© Copyright Commonwealth of Australia 1996 – 2007 GBRMPA, 2017.
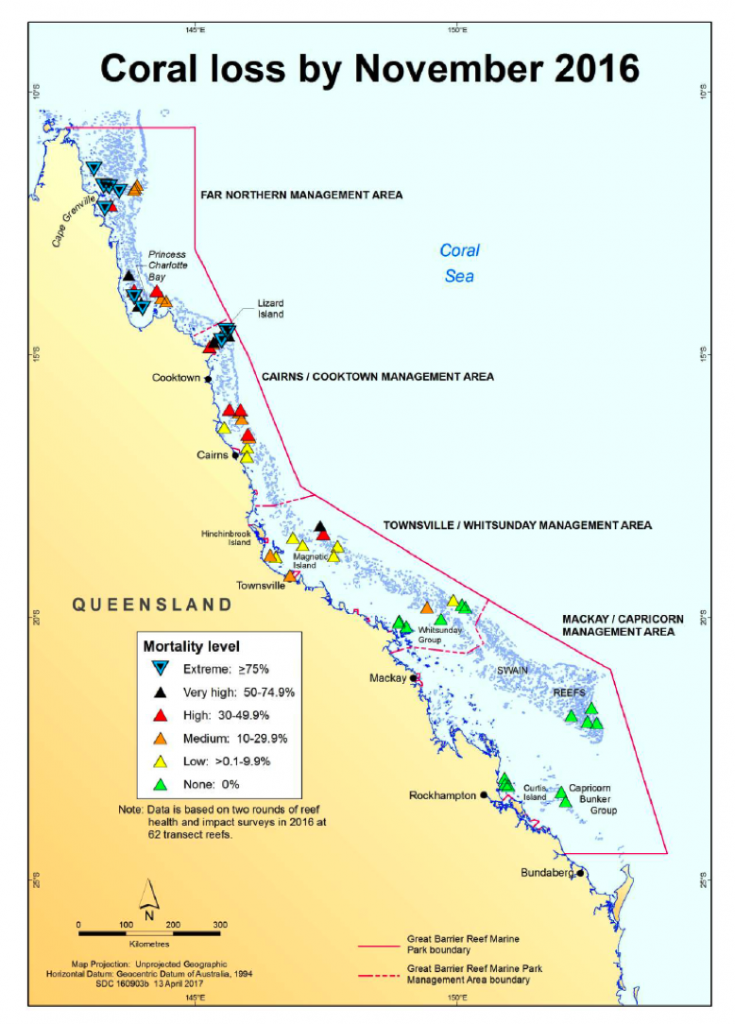
In the southern half of the Marine Park, including the Whitsundays, the second round of coral surveys (November 2016) found that coral cover remained at similar levels to immediately prior to the mass-bleaching event (Figure 3). On the majority of surveyed reefs, coral bleaching was patchy within transects and restricted to a few individual colonies. Increases in coral cover at the majority of these sites demonstrate the very limited impact of the bleaching event at that time. Only one middle shelf reef surveyed in the Whitsundays sustained medium levels of coral loss.
Figure 3. Reef-wide pattern of estimated coral loss (proxy for coral mortality) as at November 2016 on the Great Barrier Reef. Each triangle represents a reef, and colours indicate the percentage of coral cover that died (mortality level). © Copyright Commonwealth of Australia 1996 – 2007 GBRMPA, 2017.


