We have compiled some answers for our annual Report Card and other frequently asked questions. If you have any further questions, please get in touch. To view report card scores head to our online interactive report card.
Mackay-Whitsunday-Isaac (MWI) Report Card FAQs
General Questions
Why do we produce an annual waterway health report card?
Watch our video to see why we produce a Report Card, how our Report Card works and where we fit in amongst other Great Barrier Reef reporting.
How is a report card score developed?
The Mackay-Whitsunday-Isaac Report Card, launched in 2014, is a collaboration between community, Traditional Owners, farmers, fishers, industry, science, tourism, natural resource management groups and Government, who recognise that more can be delivered by working together. The report card uses the best independent science and integrates a range of Great Barrier Reef (GBR) wide and regional monitoring programs to measure waterway health in an environmental, social, economic and cultural context.
To arrive at report card indicators, priority aquatic ecosystem indicators that are suitable for measuring waterway health were selected for the report card based on relevant values and pressures in the Region. Each indicator has a relevant benchmark (for example, a water quality guideline) that signals if it is in very good or very poor condition. Regional data for each indicator is compared to benchmarks using a specific methodology to produce a score. Scores correspond to one of five condition grades: Very Good (A), Good (B), Moderate (C), Poor (D), Very Poor (E). Scores for each indicator are rolled up into categories and indices, and these scores are used to produce an overall score for an individual reporting zone in the Region.
The report card’s Technical Working Group (TWG) has worked to ensure the report card indicators and scoring methods are based on the best available science, are locally relevant, reflect changes to waterway health, and are consistent with other report card programs across Queensland where applicable.
The Partnership has also developed a 5-year report card program design to outline the frameworks used to develop the report cards between 2017 and 2022. This plan is currently undergoing review.
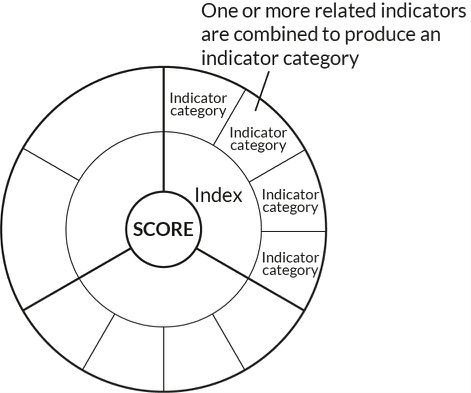
What is the difference between an indicator, indicator category and index?
An indicator is the measured feature in the ecosystem (e.g. particulate nitrogen). By combining one or more related indicators, we can produce an indicator category (e.g. the category ‘nutrients’ is made up of particulate nitrogen and particulate phosphorus). Similarly, an index is generated by combining related indicator categories (e.g. the index ‘water quality’ is made up of nutrients, water clarity, chlorophyll-a and pesticides). Lastly, the overall score is generated by one or more indices (e.g. water quality, coral, seagrass and fish indices can make up an inshore marine zone score).
Indicators, categories and indices are displayed in a ‘coaster’ to display which indicators are aggregated to produce category and index scores.
What period of time do the report cards cover?
Annual reporting covers a full financial year stretching from July 1st of one year to June 30th of the next. This timeline for annual reporting has been selected because it takes into account the dry and wet season cycle, ensuring that each wet season is included in one reporting period.
Why is there a delay between the data collection and the release of the report card?
Data must be collated from regional monitoring programs and validated before report card analysis. The data then undergoes comprehensive analysis and review before it is ready to be released in the report card. This process takes six to nine months, depending on the data type. Time is also needed to review the processes for collecting data, along with the data itself. This process is undertaken by both the Technical Working Group, and the Reef Independent Science Panel.
Are there minimum data rules for the report card?
At the indicator level, the amount of data (sample size) needed to obtain an indicator score is considered case-by-case by the data providers and the experts in the report card’s Technical Working Group. The indicator will not be scored if the sample size is considered inadequate.
To aggregate indicators into category and index scores, decision rules were developed for the minimum proportion of information required:
- ≥ 50% of measured indicators to generate the indicator category score (where relevant).
- ≥ 60% of indicator categories to generate an index score.*
Overall scores for reporting zones are presented in the report card, even if not all indices are available.
*Seagrass reporting incorporates two separate methods (each reporting two to three of their own specific indicators), which requires a separate decision rule for generating seagrass index scores. For more information, please refer to the technical reports (Methods document 3.2.4).
What is data confidence and how is it scored?
Every time an observation is made (data is collected) or a score is calculated, there is potential for error. Data confidence helps to describe how confident managers and experts are in the methods of data collection and analysis that are used to produce an indicator score reported in the report card. Confidence surrounding the report card grades is measured on a five-point scale. This tells us how confident we are, from very low to very high, that the calculated grade reflects the true condition of the indicator. Click here for more information on data confidence.
![]()
Why should some results be viewed with caution?
Results should be interpreted cautiously when confidence is not high (a score of three dots or lower). An example of this is water quality results in the freshwater river basins, which have a confidence score of three. This is because the overall score for water quality for many of the basins is derived from only one site per river basin. Even though samples are taken monthly from these sites, caution should be used when interpreting the results, as the site sampled might not represent the rest of the waterways in the basin. For example, water quality in the upper sections of a waterway may be better than in the lower section where a sample site is located and vice versa. The 2018 Report Card was the first time an additional water quality site was included in the Plane Basin. This additional site has also been included in 2019, 2020, and 2021 Report Cards, with two sites in the Plane Basin making up the overall score. For more information, see our confidence page and the interactive results page, where confidence for each indicator is shown.
Why are there grey areas in the coasters of the report card?
Grey areas indicate where there is a data gap. There can be several reasons why there are data gaps in the report card. Importantly, data used for the report card must be collected and analysed in a scientifically robust manner. This could mean that data is available on a particular indicator, but a significant body of work is still required to ensure that the indicator is reported in a suitable format for the report card. In other circumstances, there might be multiple programs collecting data, and additional analyses must be done to make sure that data between programs is consistent and comparable, as is the case for estuarine and marine fish across the region.
The Partnership is continuously improving the report card by filling data gaps and, ultimately, the grey areas on the report card. Recently, this has included reporting on the fish community in the Don Basin, seagrass in the Southern Inshore Marine Zone, and the Urban Water Stewardship Framework—a way to assess how regional councils manage urban water across the Great Barrier Reef region compared to best practice guidelines. This demonstrates the Partnership’s commitment to improving the region’s Report Card by filling data gaps and subsequently providing a better understanding of regional waterway health.
There are a number of projects underway to fill current data gaps or to expand on existing programs:
- Marine Fish: Reef fish is a critical knowledge gap in our reporting. Funded by the partnership between the Australian Government’s Reef Trust and the Great Barrier Reef Foundation, the Regional Report Card Partnerships are investigating the potential to incorporate existing marine fish citizen science programs into future report cards. We are also looking forward to the possibility of using data from the Reef Trust Partnership Integrated Monitoring and Reporting Program, now in development.
- Human Dimension: Regional report card partnerships, the Queensland Government and CSIRO, developed a social survey to understand people’s use, values and perception of our regional waterways. The survey also asked questions about waterway stewardship action and thoughts on governance. Mackay-Whitsunday-Isaac residents completed the survey in December 2021. The final results have been compiled, and we are currently working toward developing an indicator for future report cards.
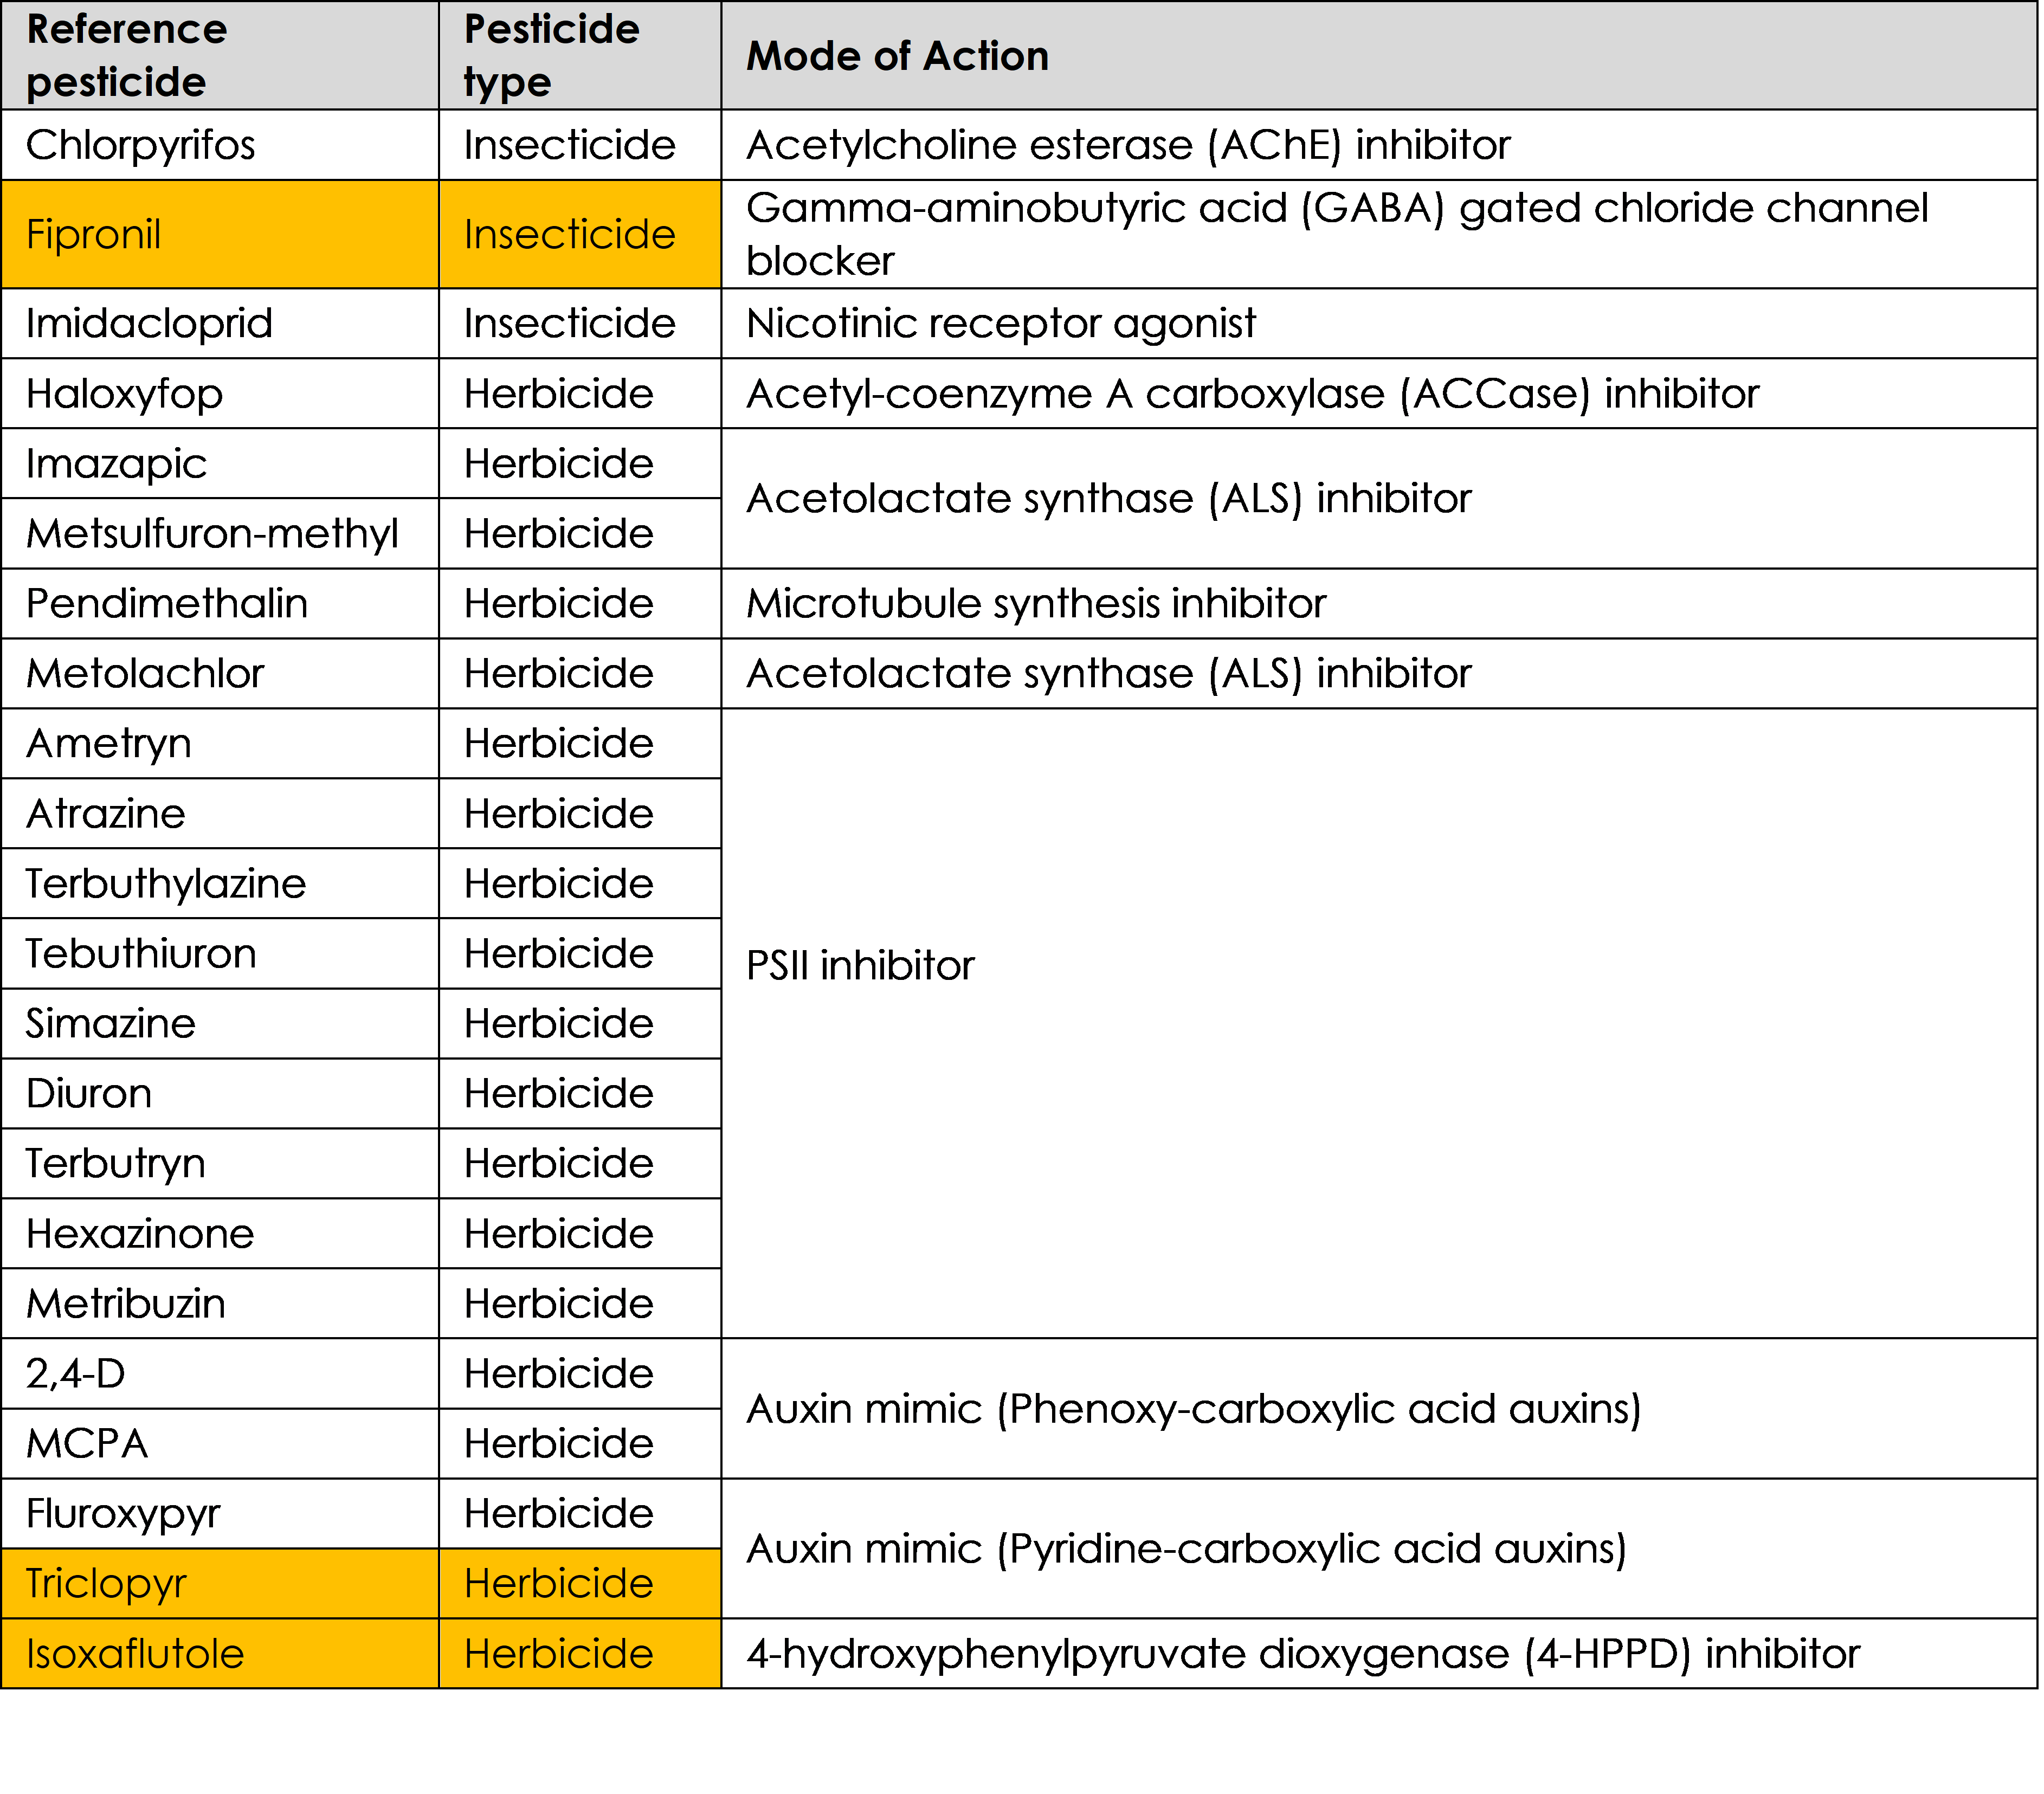
What is measured to produce the score for the pesticides indicator?
Pesticides in the report card are developed using the Pesticide Risk Metric (see Technical documents for further information). The aim of this approach is to quantify the ecological risk associated with exposure to a mixture of pesticides.
Below are the 22 pesticides that are measured in freshwater and estuary zones in the Mackay-Whitsunday-Isaac report card. Pesticide data is collected as part of the great Barrier Reef Catchment Loads Monitoring Program (GBRCLMP) water quality program run through the Queensland Government’s Department of Environment and Science. The Partnership also fund an Estuary Pesticide Monitoring Program to supplement existing data that was included in the 2019 report card for the first time.
19 pesticides are included in the inshore marine zone. Pesticides highlighted in orange in the table were not captured for the inshore marine zones for the 2019 report card.
Including additional pesticides in our report cards improves our understanding, leading to an eventual increase in confidence of pesticide concentrations in our local water ways.
What improvements have been made to fill data gaps in the report card?
Each year, we (the Healthy Rivers to Reef Partnership) work to improve the quantity and quality of data contributing to the Report Card. This commonly includes increases in sample sizes, as was the case for water quality data in the Northern and Central Zones in the 2020 Report Card. These data are provided by the North Queensland Bulk Ports Corporation Ltd (NQBP) Ambient Water Quality Monitoring Programs. In 2019-20, the sampling frequency of these programs was significantly increased, improving data resolution and reliability.
The 2020 Report Card also saw the inclusion of more citizen science data than ever before. Using data sourced from the Australian Marine Debris Initiative (AMDI) Database, the 2020 Report Card includes grades for litter for the first time. Grades are given to 33 inshore and urban sites across the Mackay-Whitsunday-Isaac Region.
Reef Check Australia coral cover data are also included in the Whitsunday and Offshore Zones for the first time. Because of Reef Check’s contribution, the 2020 Report Card includes coral monitoring data from far more sites than the 2019 Report Card.
This is the first year that data from the Seagrass Watch sites at Bowen have been incorporated into seagrass scores for the Northern Zone. The 2020 Report Card now includes data from nine Seagrass Watch sites, compared to seven in the 2019 Report Card.
There are a number of projects underway to fill current data gaps or to expand on existing programs:
- The Partnership is working within a number of the Reef 2050 Integrated Monitoring Reporting Program’s (RIMReP) working groups, including the Human Dimensions group, to develop suitable indicators and monitoring programs that can be used in future report cards. The Human Dimensions group covers social, economic, governance and cultural heritage components of the Reef 2050 Plan. For more information on RIMReP, click here.
- Urban Water Stewardship workshops were undertaken with the Mackay, Whitsunday and Isaac Regional Councils in 2020. The project benchmarks the level of management practice being applied to urban development, stormwater management and sewage treatment. Look out for these results in the 2021 Stewardship Report and 2021 Report Card.
Freshwater Fish
How is fish community health measured in our freshwater basins?
Two separate indicators of fish community health are measured to provide a condition score:
- Native species richness (number of native fish species in a sample); and
- Abundance of pest fish (proportion of a sample that is pest fish)
Fish are sampled by electrofishing. To derive a fish score, samples from the 2015/16 year were compared to what is ‘expected’ in a minimally disturbed reference stream with similar landscape attributes. The ‘expected’ fish scores are modelled from fish sampling data provided by Catchment Solutions, Reef Catchments, as well as the Department of Science, Information Technology and Innovation from reference waterways.
Currently, the diversity of species (composition) that are observed during the sampling are not considered when determining a condition score. More work will be undertaken in the future to improve the ‘expected’ model and examine how fish community health can incorporate species composition in the overall score.
Why are we seeing good freshwater fish scores but poor pesticide scores?
There are a number of reasons why the current freshwater fish scores are graded as ‘good’ or ‘very good’ and pesticide grades for basins in the region are graded as ‘poor’. In October 2020, we consulted with a number of fish and pesticide experts across Queensland to answer this question – see the full story by clicking the link below:
Answering your questions on freshwater fish, pesticides and waterway health
Pesticides
How do pesticides impact our local waterways?
Pesticides are designed to kill or negatively affect insects and/or weeds. Unfortunately, this is not limited to the target species affecting the crop. When they enter waterways, they can be harmful to many species of plants and animals in both freshwater and marine ecosystems.
Farmers have been carefully watching their pesticide inputs, so why are pesticides still an issue in our waterways?
There are many reasons why pesticides continue to be an issue in waterways in the Mackay-Whitsunday-Isaac Region. A few of the key reasons include:
1. Pesticide types and purposes
The effect of a pesticide in a given waterway depends on what types and amounts of pesticides are being used. This determines what the overall potential risk of pesticides are in a waterway. For more information on pesticide risk and how they relate to animals like fish in our waterways, see this article on our website.
2. Chemical half-life
All pesticides have something called a ‘half-life’, which is the amount of time a chemical continues to exist in the environment after being applied. This varies depending on the pesticide type and environmental conditions. For some of the pesticides that are commonly used in the MWI Region, such as imidacloprid, the chemical can be detected in the environment for over 170 days. This provides another potential challenge in pesticide management. To learn more about innovative work being done to minimise pesticide risk in our waterways, see Sugar Research Australia’s report here.
3. Timing of application
Related to pesticide half-life, the timing of application affects how pesticides are likely to enter the waterway as runoff. For example, if pesticides are applied to a field shortly before heavy rainfall or irrigation, it is likely that most of the chemical will be washed off of the crop, potentially into nearby waterways. As a guide, residual herbicides require a minimum of two days without rainfall or irrigation to ‘bind’ to the soil after it is applied.
For more information on the environmental considerations in pesticide management for the region, see Sugar Research Australia’s report here.
Why isn’t there a pesticide score in the Whitsunday Inshore zone?
Pesticides are not monitored in the Whitsunday Zone, as previous Marine Monitoring Program investigations found that the pesticide risk is very low with no major creeks or rivers flowing into this zone. There is a pesticide monitoring site at Repulse Bay, just south of the Whitsunday Inshore Zone boundary. This monitoring site is positioned so it captures outflow from the Proserpine River.
Water Quality including nutrients, water clarity, and chlorophyll-a
What is “suspended sediment”?
Suspended sediment refers to sediment, for example particles of soil, sand and silt, that is floating in the water column.
How do we know that sediment levels are high enough to be a problem?
To test whether sediment levels in our basins are too high, we measure the amount of sediment in the water over the course of the year – especially during the wet season when we expect the most sediment to be ‘flushed’ from the surrounding land into our waterways. We then compare these sediment measurements to a ‘guideline’ for each waterway (i.e. what a healthy amount of sediment in the waterway should be), and assign a ‘grade’ based on whether or not the sediment we see in the waterway matches how much should be in the waterway.
Unfortunately, since we began reporting on sediment, the majority of our region’s basins have seen higher reported levels of sediment than is healthy for these systems (most basins usually grade at ‘moderate’ risk, depending on the year). Click here for more information on why sediment is a concern in the GBR.
What influences sediment levels in our waterways?
Disturbance around or in our waterways can influence the amount of sediment in the water. Here are a few examples of sediment influences in our region:
- Human activities such as dredging and development can stir up sediment and cause erosion.
- Clearing of vegetation around waterways (i.e. riparian vegetation) can also greatly increase the amount of sediment washing into the water. This is because these plants usually trap large amounts of sediment before it can move into the waterway and be washed into the marine system.
- Animals, including cattle and feral pigs, can also contribute to erosion in regional waterways by feeding on riparian vegetation and physically eroding the landscape.
What is the difference between the various water clarity indicators used in the Report Card?
Across the Report Card we use three different water clarity indicators – total suspended solids (TSS), secchi disk depth and turbidity.
These indicators evaluate water clarity and the amount of light that can reach the seafloor, which is essential to seagrass and coral growth. Light can be reduced in the water by three things: suspended sediments, chlorophyll (primary production) and coloured dissolved organic matter (CDOM). Turbidity and secchi depth measurements account for all three components, while TSS analysis accounts for only suspended sediment and chlorophyll.
The characteristics of suspended sediment can greatly influence turbidity measurements. For example, darker and finer-grained sediment will result in much higher turbidity readings than lighter-coloured and coarser sediments. These darker and finer-grained sediments are considered the most damaging to seagrass and coral growth (Bainbridge et al., 2018; Storlazzi et al., 2015).
As a result of these factors, turbidity is recommended as the ‘primary’ measure of water clarity, with secchi and TSS providing supporting evidence to clarify patterns.
Why are high levels of sediment bad for coral and seagrass?
Sediment is an issue for coral and seagrass in three major ways. Firstly, sediment enters the ocean floating in the water, similar to how dust floats through the air. If there are a lot of sediment particles floating in the water, they can block sunlight from reaching the coral on the seafloor. As coral and seagrass both need sunlight to produce energy, high sediment levels can greatly impact the growth and survival of these important species.
The second problem comes when sediment particles being carried in the water eventually drop out and settle on to the coral. If too much sediment lands on the coral and it is not washed off of the coral in time, the coral may suffocate as it is unable to access enough oxygen or sunlight to produce energy. Click here for more information.
Sediment may instead settle onto pieces of rock or old coral rubble. These are usually ideal places for new corals to attach to. If there is a large amount of sediment on these areas, this means that there is less free space for coral recruitment.
What is chlorophyll-a?
Chlorophyll is what creates the green colour in plant cells that allows them to make energy to grow. Chlorophyll-a is a particular type of chlorophyll. Specifically, the chlorophyll-a indicator measures the level of ‘microalgae’ (e.g. diatoms and phytoplankton) in the water.
Is chlorophyll-a good or bad for our waterways?
Chlorophyll-a is a natural and essential part of all plants in our waterways. The issue with chlorophyll-a comes when the measured levels are higher than what is considered to be ‘normal’ for an ecosystem. Big increases in the amount of chlorophyll-a in the waterways are usually linked to higher levels of nutrients in the water. High levels of algal chlorophyll in the water can block sunlight from reaching aquatic plants (e.g. seagrass) and coral. At an extreme level, this creates what is known as an algal bloom, which can cause major issues for local aquatic plants and animals by reducing the amount of oxygen and light in the water and releasing toxic chemicals.
Why isn’t there a water quality grade for the Proserpine Basin?
The monitoring site within the Proserpine Basin at Glen Isla was deemed unsuitable as a freshwater site due to concerns of tidal influence. A pilot project was conducted that monitored monthly ambient conditions at a site upstream from the Glen Isla site. Unfortunately, that site was unsuitable as well, as it was found to be downstream of an artificially constructed sand dam. Although it was reported that the sand dam was removed in the winter of 2021. We are yet to establish a representative freshwater site in the Proserpine Basin.
Potential partners interested in helping establish a freshwater monitoring site for the Proserpine Basin are encouraged to contact us.
What happened to the grade for water quality in the Offshore Marine Zone?
Offshore marine water quality scores were previously sourced from the Bureau of Meteorology (BOM) Marine Water Quality (MWQ) dashboard. In early 2021, BOM advised that the MWQ dashboard had been decommissioned and the underlying data would be discontinued during the year. Alternative data sources are currently being identified for reporting offshore water quality for the 2021–22 reporting period.
Marine life
Why are macroalgae bad for coral growth?
Macroalgae is the term used to describe most seaweeds and marine algae that are visible to the naked eye. Macroalgae play important roles on coral reefs, including being a major food source and creating habitat for many invertebrates and fish. Macroalgae become an issue when they are in excess of what is sustainable for an ecosystem, which can occur because of ecosystem disturbances such as over-fishing of herbivorous fish or from pollution by excess nutrients and sediments. Increasing levels of macroalgae on a coral reef typically indicates reef degradation. Once macroalgae has begun to dominate a coral reef, it can reduce the amount of clear rock or rubble for juvenile corals to attach to. The faster growing macroalgae will also often outcompete those new corals that do find a place to settle, preventing recovery of the coral reef.
In the 2021 Report Card, why was seagrass in the Southern Inshore Marine Zone ‘moderate’ even though the indicators were ‘good’ or ‘very good’?
Seagrass scores in the Southern Zone are based on three indicators: biomass, area, and composition. Each site in this zone is given an overall score based on the lowest scoring indicator. The overall zone score is then calculated by obtaining an average of all the overall site scores,rather than being an average of the three indicators.
Read our blog post for a further explanation of the seagrass scores.
Habitat and Hydrology
How does the flow indicator category tool work?
The flow indicator category tells us about how human activities have influenced streamflow in our region. This category has ten indicators which bring together information on the frequency and duration of periods of no/low/medium/high flow, and characteristics of flow in the dry season specifically. We compare the current flow levels against modelled ‘pre-development flow’ levels. This refers to simulated streamflow without the influence of dams and other water infrastructure and with no extraction for urban or agricultural use. Taking into account the impact that annual rainfall has on freshwater flow, we can therefore, give a score to the impact that humans have had on flow levels for that year.
Are the flow indicators impacted by annual rainfall?
The scoring system for the flow indicators takes into account the rainfall for that year. Current flow levels are compared against simulated ‘pre-development flow’ levels for years when there was a similar amount of rainfall. Changes in the score given to flow is therefore, not related to annual rainfall, and we can better understand the impacts of human activities like water extraction or damming, on flow levels.
Human Dimensions
What is measured in the cultural heritage assessments?
Cultural Heritage site assessments were reported in the 2015 and 2018 Report Cards. Cultural Heritage assessments evaluated the value and condition of Indigenous cultural heritage sites associated with waterways throughout the region. Site types that were assessed included shell middens and scatters, rock shelters, paintings, engravings, stone artefacts, quarries, stone resources and fish traps.
Assessments have been undertaken in the St Helens, Cape Hillsborough , Cape Palmerston and Whitsunday Islands zones. Assessments are undertaken for the Mackay-Whitsunday-Isaac Healthy Rivers to Reef Partnership, in collaboration with the Traditional Owner Reference Group (TORG) who represent the Yuwibura, Koinjmal/Koinmerburra, Barada/Widi, and Ngaro/Gia/Juru Traditional Owners.
Cultural Heritage site assessments were updated in late-2020 and will be released in the 2021 Report Card (released in 2022).
For more information on cultural heritage assessments, see our Cultural heritage page.
What are social and economic indicators and why do we measure them?
Social and Economic indicators have been developed to understand the dynamic relationship between people and the natural environment such as the Great Barrier Reef (GBR). This relationship is described as the ‘human dimension’ of environmental management, acknowledging that people value, depend on and interact with the Reef. The social component of the report card aims to represent the perceptions held by local residents regarding the condition and management of the GBR and its associated waterways and, importantly, their individual capacity to take action that will influence positive environmental change in these systems. The indicators also assess the value and wellbeing benefits that community derive from the GBR. The economic component of the report card assesses perceptions of economic opportunity provided by the GBR.
It is important to measure perceptions of social and economic indicators over time, to identify changes in the way the community perceive and value the Reef. In turn, this helps Reef managers to align the Marine Park priorities with that of the community. Social and economic indicators are measured using data derived from the Social and Economic Long Term Monitoring Program (SELTMP), which surveys local residents and tourists in population centres along the GBR coastline.
What is stewardship and how do we measure it?
We assess both agricultural and non-agricultural stewardship in the Mackay-Whitsunday-Isaac Report Card. We define stewardship as “responsible and sustainable use and protection of our water resources, waterways and catchments to enhance the social, cultural, environmental and economic values of the Region”.
The Partnership currently assesses annually how our regional industries are performing against stewardship criteria. Stewardship is important to include in our annual report cards as it provides information on the actions that landholders and organisations in the Region are implementing that will provide benefits to ecosystems.
Each year we assess management efforts by our major non-agricultural industries that maintain or improve the condition of our waterways. These efforts are scored across three activity groups (administration, operations, and development) and across three management themes (planning, implementation, and outcome). Data is collected via questionnaires to a series of organisations/companies from each industry. Information in the public domain such as management plans, as well as compliance data (with confidential information removed) is also added to the data pool for each industry. A stewardship score is then calculated for each management theme and activity group for each industry across four categories: ineffective, partially effective, effective and very effective management practices.
For the agriculture assessment, the Mackay-Whitsunday-Isaac Report Card aligns its stewardship reporting with the GBR Report Card, which are reported through the Paddock to Reef (P2R) program. Frameworks that have been developed, reviewed, and endorsed by industry are currently available for grazing, sugarcane, and horticulture and are based on the joint Australian and Queensland Government’s Paddock to Reef reporting that uses “Water Quality Risk frameworks” (previously “ABCD Frameworks”).
Threats to our waterways
How is climate change impacting our local waterways?
Climate change is happening at a global scale and is impacting aquatic environments dramatically.
Rising sea surface temperature (SST) is already causing more marine heatwaves, and these will become hotter and will last longer. Major coral bleaching events are now happening almost every year, with many other aquatic animals and plants also suffering from heat stress during these events. Increases in SST will also cause changes in ocean circulation, impacting species such as reef fish, whales and turtles that use currents to navigate and disperse.
Climate change will also change rainfall patterns across our region. In general, annual rainfall is expected to decrease. Basins will therefore have lower water levels and reduced flow which can impact aquatic species’ population connectivity and migration. Lower rainfall will also put a higher reliance on irrigation, which extracts water from our local basins. While average annual rainfall in expected to decline, there will however, be an increase in the intensity of big rainfall events. This may cause more flooding and erosion of streambanks and coastal areas, and subsequently higher levels of sediment, nutrients and pesticides in our waterways.
The number of cyclones happening each year is actually expected to decrease under climate change influences. However, their individual strength is predicted to increase. Cyclones will therefore, be more destructive to coral reefs, seagrass meadows, and other aquatic and land-based plants and animals. This also presents a major issue for local communities, with an increased risk of urban cyclone damage and flooding.
With rising carbon dioxide (CO2) levels in the atmosphere, the amount of CO2 absorbed by the ocean is also increasing. This is slowly making the ocean more acidic, which will impact on any species that use calcium carbonate to build their skeletons or shells. This includes crustaceans (e.g. crabs and lobsters), bivalves (e.g. clams, scallops and oysters) and corals.
What are the major threats to our local waterways?
Climate change is one of the biggest threats to our local waterways, particularly our coral reefs. The Great Barrier Reef (GBR) Marine Park Authority (GBRMPA) listed climate change as the largest threat to the GBR, through rising sea surface temperatures, increased cyclone strength, ocean acidification and increased likelihood of flooding from more variable rainfall levels (GBRMPA, 2019). Flooding is an issue for freshwater, estuarine and marine ecosystems as it can substantially decrease water quality.
Water quality has been an issue for the GBR for many years, specifically regarding increased nutrient levels and pesticides, and declining water clarity (all addressed in the Report Card). Agricultural land-use has increased erosion around waterways and the discharge of nitrogen, phosphorus and sediment onto the GBR (Biggs et al. 2013; Brodie et al. 2010). This is made worse during floods and periods of high rainfall. These factors can cause harmful algal blooms, block sunlight in the water and smother aquatic plants and coral. These impacts can extend for many hundreds of kilometres past the river mouth (e.g. Brodie et al. 2010).
Poor water quality is a particular concern in the Whitsundays, with locals reporting a decline in water clarity since 2011 (read more here). This is not only an issue for tourism but for the coral reefs themselves, due to the sediment blocking sunlight and smothering coral as mentioned above. High levels of sediment also means that there is less free reef space for juvenile corals to settle on to. These factors, along with high levels of macroalgae, have prevented strong recovery of the Whitsunday coral reefs after Cyclone Debbie in 2017.
Pesticides entering our local waterways are also of concern, particularly for critical seagrass and mangrove communities (Haynes et al. 2000; Mitchell et al. 2005). Pesticides that are commonly used in the Mackay-Whitsunday-Isaac Region, such as diuron, are suggested to be directly linked to mangrove diebacks in the estuarine areas of the Pioneer Basin (see Mitchell et al. 2005). Reduced mangrove habitat can have dramatic flow-on impacts to many species of commercially and recreationally important fish and invertebrates.
Urban development can also play a significant role in the health of our waterways. For example, in the Report Card we report on riparian, mangrove/saltmarsh, and wetland extent. These indicators report the extent of current vegetation in the region relative to pre-urban development (termed ‘pre-clear’). Urban developments can also impact waterways through the movement of sediment during construction, and through pollution (point and diffuse source influence).
To take a closer look at what is being done in our region to minimise urban development influences on our waterways, we are working with the Mackay, Whitsunday, and Isaac Regional Councils to develop an ‘Urban Water Stewardship’ indicator. Stay tuned for the 2020 Stewardship Report to learn more about this indicator!
How much influence do the catchments and riverine inputs have on the marine environment?
Annual influence of riverine input:
The coastal currents generally flow northward, and coral coring data and eReefs model simulations suggest that the Fitzroy River has the largest influence on water quality in the MWI region, particularly along the offshore coastal waters of the Whitsunday Islands. The influence of the Pioneer and O’Connell Rivers are more variable, with stronger influence in low-flow years and in the first half of the year, before the wet season discharge from the Fitzroy reaches the region. The Pioneer River often influences the inshore waters of the Whitsunday Islands, and the O’Connell River’s influence is generally dominant only in Repulse Bay. Although, in low flow years its influence can extend northward past the Molle Islands and into Pioneer Bay. In high flow years, the Burdekin River can impact the Whitsunday midshelf islands (such as Hook Island), although its influence is slight as it generally flows further northward (Baird et al. 2019).
Long-term influence of riverine input:
One of the most influential factors to regional water quality is the nepheloid layer—fine, silty sediments that sit on the seabed and are continually resuspended with tidal flow and wave action. This nepheloid layer is responsible for roughly 90 per cent of light reduction in the water column and can greatly influence water quality and subsequently, the health of corals and seagrass. The other 10 per cent of light reduction is due to riverine ultra-fine particles.
While there is still much to learn about the nepheloid layer, we know that riverine input and dredging can contribute to its development, and that sediment is accumulating at a faster rate than it can be dispersed. Sediment accumulation is likely also influenced by the reduction in riparian vegetation, wetlands and mangrove extent. These ecosystems play a role in reducing erosion and filtering water before it reaches the marine environment.
What can I do to help improve the health of my waterways?
We all have a part to play in keeping our region’s waterways beautiful and pristine. Here are just a few ways that you can help waterway health in the MWI Region:
- Plant native species along the edges of your local creeks and rivers to reduce sediment erosion and subsequent nutrient and pesticide runoff. Contact your local Landcare office for guidance on what are the best species to plant.
- Make sure you put all rubbish in the bin and recycle whatever materials are possible (see your local council’s website for information on what you can recycle).
- If you are a farmer, you can manage your fertiliser and pesticide input to minimise runoff and maximise the amount kept on the crop.
- Adopt more waterway friendly products and practises in your home and garden (learn more in our 2021 ‘Above and Beyond’ magazine).
- Join a citizen science group in the region to contribute data on waterway health! Ask your local Natural Resource Management organisations for more information on what volunteer opportunities are near you.
- Take action on climate change. Keep climate change policy in mind when voting in local, state and federal elections.
The Mackay-Whitsunday-Isaac (MWI) Report Card vs the Reef 2050 Water Quality Report Card
What are the differences between the Reef 2050 and MWI Report Cards?
The Reef 2050 Water Quality Report Card addresses the entire Great Barrier Reef system and measures progress towards the goals and targets of the Reef 2050 Water Quality Improvement Plan (replacing the 2013 Reef Water Quality Protection Plan). The Mackay-Whitsunday-Isaac (MWI) Report Card is one of five regional report cards along the coast of the GBR that reports on the health of our waterways and ecosystems at a local level. Being able to understand the health of local ecosystems alongside local community values enables management priorities and actions to occur at a regional scale. Our Partnership is a group of 34 organisations that use the report card to help direct action and funding to keeping our waterways and ecosystems healthy.
The MWI Report Card reports on a number of different ecosystem health indicators as compared with other regional report cards in Queensland. Indicators are tailored to each region and are chosen by each Partnership. This report card explainer highlights the indicators that each Partnership uses in their report cards.
How does the MWI geographical area differ between the MWI and the GBR Report Card?
The geographical area of the Mackay-Whitsunday-Isaac (MWI) Report Card includes the Don, Proserpine, O’Connell, Pioneer, and Plane River basins. The MWI Report Card also reports on offshore and inshore waters separately and divides the inshore area into four separate zones (the Northern, Whitsunday, Central and Southern Zones). In comparison, the GBR Report Card does not include the Don Basin nor offshore waters when referring to the Mackay-Whitsunday region, and reports on the inshore zone as a whole.
What is Paddock to Reef, and which of their datasets are used in the MWI Report Card?
The Paddock to Reef Integrated Monitoring, Modelling and Reporting Program (Paddock to Reef, established in 2009) is a collaboration between governments, industry bodies, regional natural resource management bodies, landholders and research organisations. The program collects and integrates data on agricultural management practices, catchment indicators, catchment loads and the health of the Great Barrier Reef.
The Mackay-Whitsunday-Isaac Report Card draws on data from the Paddock to Reef Program to report on seagrass, coral and water quality in our inshore marine zones, water quality in our catchments, and management practice of our sugarcane, grazing and horticulture industries.
Why might there be differences in management practice scores for sugarcane, grazing and horticulture compared to the GBR Report Card?
Management practice data is reported at the Natural Resource Management (NRM) region level. However, because the Mackay-Whitsunday-Isaac report card includes the Don basin (meaning it is not the same as the Mackay-Whitsunday NRM region), this means that management practice data may be different to the GBR report card.
One example of these regional reporting differences is that the GBR report card does not include the Don basin when reporting the Mackay-Whitsunday-Isaac region. This is particularly relevant to grazing and horticulture management practice reporting. Because there is minimal horticulture in the Proserpine, O’Connell, Pioneer, and Plane basins, horticulture is not reported in the Mackay-Whitsunday region in the GBR report card. However, horticulture is a key land use activity in the Don basin, which means that it is included in the Mackay-Whitsunday-Isaac report card.
Why might there be differences in scores for inshore marine indicators for the Mackay-Whitsunday-Isaac (MWI) Report Card compared to those in the Reef 2050 Water Quality Report Card, even though the same data is used?
There are currently four different seagrass monitoring programs in the MWI region: the Marine Monitoring Program (MMP), the Queensland Ports Seagrass Monitoring Program (QPSMP), the Southern Inshore Monitoring Program (SIP), and Seagrass Watch citizen science network. The MMP and QPSMP have different aims, which means that they do not measure the same seagrass attributes or use the same methodologies. SIP follows the same methodology and measures the same attributes as the QPSMP, while Seagrass Watch follows the methodology and measures of the MMP. Data from all of these programs are used to produce a seagrass score for the four inshore marine zones.
Condition scores for the four inshore zones in the MWI Report Card are calculated from seagrass, coral, and water quality data. The data is obtained through the QPSMP (commissioned by North Queensland Bulk Ports), Paddock to Reef (Reef 2050 report card), SIP, and the incorporation of data from citizen science initiatives. Data in the MWI Report Card is also assessed differently to the Reef 2050 Report Card, as they are reported in four separate inshore marine zones. As a result, this can mean that scores for seagrass, coral, and water quality in the MWI Report Card do not always match the Reef 2050 Report Card.
What is the difference in reporting pollutants (nutrients, sediment and pesticides) in catchments, between the MWI Report Card and the GBR Report Card?
In river basins (also known as catchments), the Mackay-Whitsunday-Isaac Report Card reports pollutants, including nutrients, sediment, and pesticides as one index titled ‘water quality’. This index is based on the annual concentrations of these pollutants in the waterways.
This method is different to the GBR Report Card in a couple ways. While the GBR Report Card reports the same pollutant groups as the MWI Report Card, it reports them as estimates of the annual average reduction in a) human-caused nutrients, b) sediment and c) pesticide loads at the end of catchments (an annual load delivered to the marine environment), which is based on modelling. These catchment loads are an indication of the total mass of pollutants entering the GBR over a period of time, whereas measuring the concentration of pollutants via water quality sampling (done in the MWI Report Card) gives a snapshot of waterway health at that one location at that time.
Therefore, even though the same pollutants are being reported in our catchments, the two report cards actually report two different sides of waterway health. Because of this, they cannot be expected to match, nor can they be directly compared.