Using data to reduce waterway plastic and marine debris
The Whitsunday Gross Pollutant Trap Project combined monitoring with action. Not only did we collect data on litter items to identify possible solutions, we also intercepted this litter and prevented it from reaching our waterways and Great Barrier Reef.
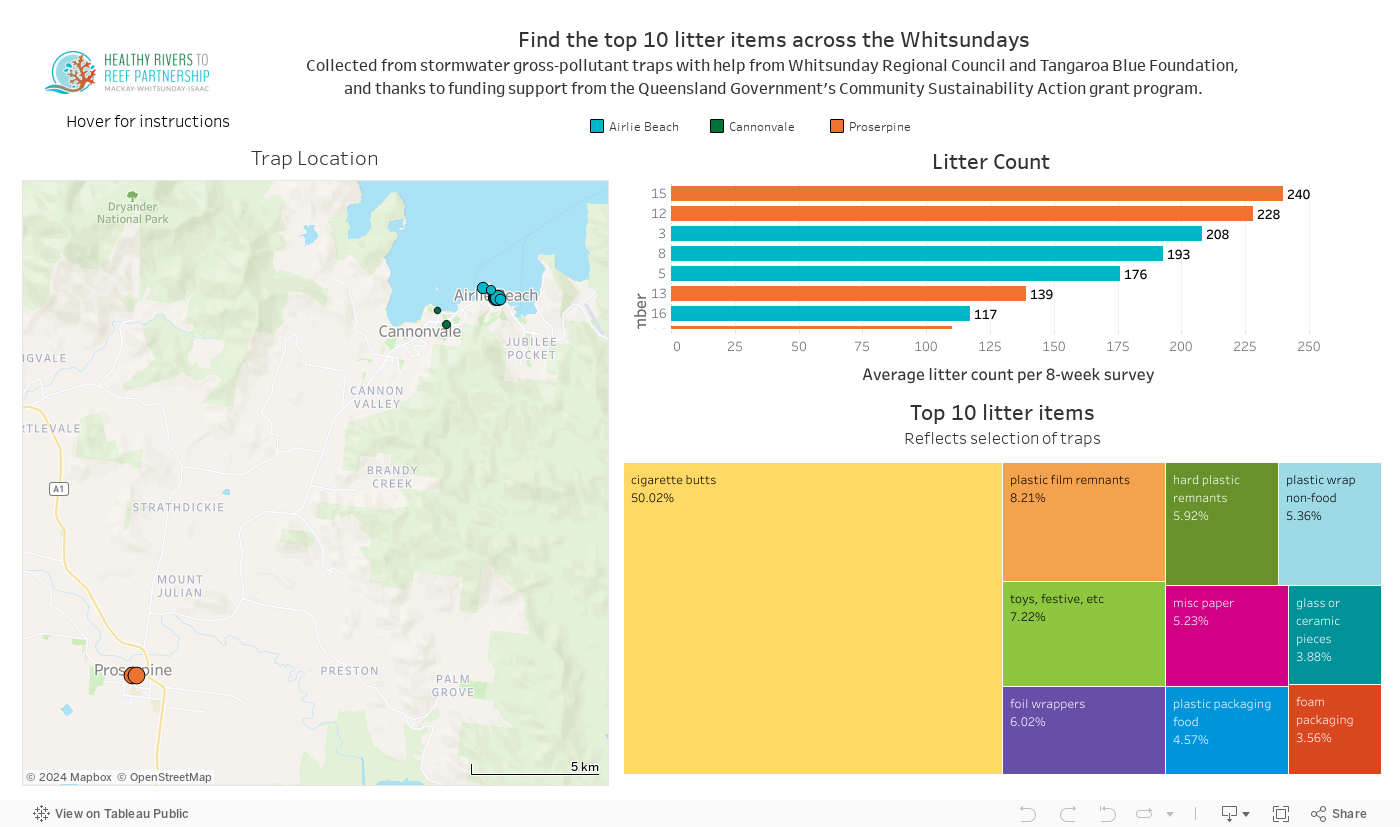
Together with Whitsunday Regional Council and Tangaroa Blue Foundation, we installed special drain traps in 15 locations across the Whitsundays including Proserpine, Airlie Beach and Cannonvale in late 2021. Every eight weeks, we collected the contents of these traps and entered the findings into the Australian Marine Debris Initiative (AMDI) Database.
A total of 27 volunteers were registered over the life of the project to help us with our litter audits, which were held at Coral Sea Marina as part of their Coral Sea Academy.
Our last audit was completed in April 2023, with the results published in July 2023 as part of the 2022 Report Card.
Overwhelmingly, we found cigarette butts to be the top pollutant in the Whitsunday region, with over 7,000 pieces intercepted in our drain traps.
We’ve used this data and worked with Tangaroa Blue Foundation and local businesses to install dedicated ‘butt bins’ and educational signage to help residents to ‘Ditch the Flick’.
The project officially wrapped up in June 2023, however the drain traps are still installed and will be serviced and maintained by Whitsunday Regional Council.


PROJECT SUMMARY
- 15 litter traps installed across the Whitsunday region in late 2021.
- Trap contents were collected and sorted every 8 weeks, with the help of volunteers.
- 3 internal audits, plus 6 Community Litter Audits held at Coral Sea Marina – a total of 27 volunteers registered.
- Findings entered in the Australian Marine Debris Initiative (AMDI) Database.
- Data is used to form a source reduction plan and prevent litter from entering our waterways.
- Cigarette butts are found to be the most recorded pollutant with over 7,000 pieces intercepted over the life of the project.
- With help from Tangaroa Blue Foundation and local venues, we’ve installed cigarette butt bins to help local residents ‘Ditch the Flick’.
Project partners
This two-year was possible thanks to $50,000 of funding support from the Queensland Government’s Community Sustainability Action grant program and a $15,000 contribution from the Healthy Rivers to Reef Partnership.
We’d also like to thank Tangaroa Blue Foundation for their collaboration and support in sharing their Ditch the Flick messaging associated with the Australian Government’s ReefClean Initiative. ReefClean is funded by the Australian Government’s Reef Trust and delivered by Tangaroa Blue Foundation.


