Collecting Estuary Report Card Data
Out in the field
Healthy Rivers to Reef technical officer Michelle Perez joined one of our data providers recently as they collected estuary samples for our next dataset.
Michelle visited eight estuaries across our reporting area, from Carmila Creek in the south all the way to Gregory River in the north to get samples from 18 sites.
“It was really great to get out and see where our data comes from, what is being measured, how it’s being done, and helping us identify any gaps in the data,” Michelle said.
“This will help when it comes to analysing the data for the next Report Card, as I will have more regional context and a greater understanding of how the data is collected.
“My favourite estuary was the Gregory River because it has some great views of the surrounding tree-covered hills [Cape Gloucester] and had beautiful mangrove-covered creeks just off the main part of the Gregory River.”
Note: This video was filmed for engagement purposes only. The correct sample collection techniques are followed when capturing data for our Report Card.
Like Clockwork
For estuary sampling in the Mackay-Whitsunday-Isaac region, our data provider visits the exact same 18 sites every month, usually around the same time each month, and always on the outgoing tide. This process is repeated every month, and the data is provided to us annually.
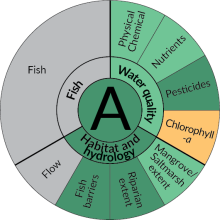
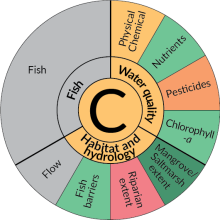
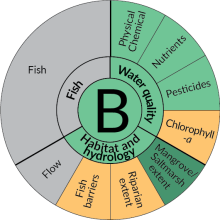
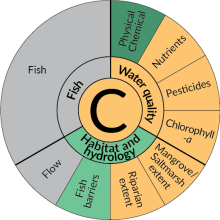
With multiple tests taken at each site and each test varying depending on what indicator was being measured – it’s a very complex process. If you look at the water quality segment on the report card grade coasters below, you can see all the different indicators that are tested, at each site, every month!
The sampling program that we get our estuary data from was established more than 20 years ago – with techniques and methodologies improving all the time. Our report card is one of the ways that we can identify opportunities to improve sampling programs by looking at trends over time, and determine whether testing methods need to be adapted to suit the local conditions.
Grades at a glance
Our 2021 Report Card, released in August 2022, has our latest data on estuary condition in the Mackay-Whitsunday-Isaac region.
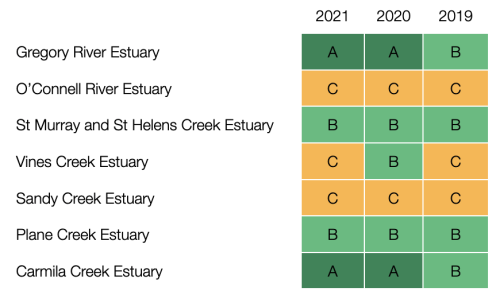
Gregory River
Overall water quality has scored ‘good’ or above since the report card’s inception.
O’Connell River
Water quality has scored ‘moderate’ for a fourth year in a row. The lake-like characteristics of the O’Connell likely contribute to water quality in this estuary.
Murray and St Helens Creek
Overall water quality has remained ‘good’ for the second consecutive year since improving from a ‘moderate’ grade in 2019.
Vines Creek
Overall water quality declined from ‘good’ to ‘moderate’ due to high nitrogen levels recorded every month during the monitoring period.
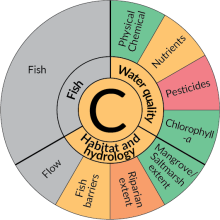
Sandy Creek
Overall water quality has remained ‘moderate’ every year since 2015, except for 2018 when it received a ‘good’ grade.
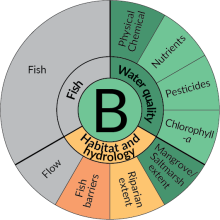
Plane Creek
Overall water quality improved to ‘very good’ after scoring ‘good’ for the past six years. This was due to improvements in dissolved oxygen results, which is part of the physical-chemical indicator.
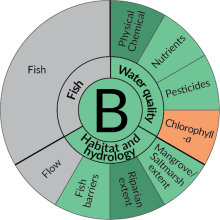
Rocky Dam Creek
Pesticide risk jumped two grades, from ‘poor’ to ‘good’ due to a decrease in chemicals commonly associated with agricultural practice in the region.
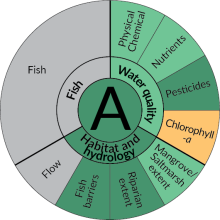
Carmila Creek
Overall water quality is ‘good’ for the third year in a row. High levels of dissolved oxygen and chlorophyll-a were recorded intermittently over a number of years. We have just finished additional sampling to understand the natural range expected in this system. Keep an eye out for the results due for release in late 2022.

Over the years
An overview of the estuary grades over the last three years.
The Healthy Rivers to Reef Partnership is supported by the Queensland, Australian and local governments, industry and community partners.


